


[ad_1]
Record results exceed annual guidance reflecting strong marketing contribution due to higher commodity prices
All financial figures are in Canadian dollars unless otherwise noted. This news release refers to certain financial measures and ratios that are not specified, defined or determined in accordance with Generally Accepted Accounting Principles ("GAAP"), including net revenue; adjusted earnings before interest, taxes, depreciation and amortization ("adjusted EBITDA"); adjusted cash flow from operating activities; and adjusted cash flow from operating activities per common share. For more information see "Non-GAAP and Other Financial Measures" herein.
CALGARY, AB, Feb. 24, 2022 /PRNewswire/ – Pembina Pipeline Corporation ("Pembina" or the "Company") (TSX:PPL) (NYSE:PBA) announced today its financial and operating results for the fourth quarter and full year 2021.
Financial and Operational Overview
|
3 Months Ended December 31 |
12 Months Ended December 31 |
|||
|
($ millions, except where noted) |
2021 |
2020 |
2021 |
2020 |
|
Revenue |
2,560 |
1,680 |
8,627 |
5,953 |
|
Net revenue(1) |
1,084 |
954 |
3,938 |
3,444 |
|
Gross profit |
785 |
247 |
2,647 |
2,008 |
|
Earnings (loss) |
80 |
(1,216) |
1,242 |
(316) |
|
Earnings (loss) per common share – basic (dollars) |
0.08 |
(2.28) |
2.00 |
(0.86) |
|
Earnings (loss) per common share – diluted (dollars) |
0.08 |
(2.28) |
1.99 |
(0.86) |
|
Cash flow from operating activities |
697 |
766 |
2,650 |
2,252 |
|
Cash flow from operating activities per common share – basic (dollars) |
1.27 |
1.39 |
4.82 |
4.10 |
|
Adjusted cash flow from operating activities(1) |
734 |
603 |
2,640 |
2,289 |
|
Adjusted cash flow from operating activities per common share – basic (dollars)(1) |
1.33 |
1.10 |
4.80 |
4.16 |
|
Common share dividends declared |
346 |
346 |
1,386 |
1,385 |
|
Dividends per common share (dollars) |
0.63 |
0.63 |
2.52 |
2.52 |
|
Capital expenditures |
176 |
161 |
658 |
1,029 |
|
Total volume (mboe/d)(2) |
3,437 |
3,614 |
3,456 |
3,500 |
|
Adjusted EBITDA(1) |
970 |
866 |
3,433 |
3,281 |
|
(1) |
Refer to "Non-GAAP and Other Financial Measures". |
|
(2) |
Total revenue volumes. Revenue volumes are physical volumes plus volumes recognized from take-or-pay commitments. Volumes are stated in thousand barrels of oil equivalent per day ("mboe/d"), with natural gas volumes converted to mboe/d from millions of cubic feet per day ("MMcf/d") at a 6:1 ratio. |
Financial and Operational Overview by Division
|
3 Months Ended December 31 |
12 Months Ended December 31 |
|||||||||||
|
2021 |
2020 |
2021 |
2020 |
|||||||||
|
($ millions, except where noted) |
Volumes(1) |
Reportable |
Adjusted EBITDA(2) |
Volumes(1) |
Reportable |
Adjusted EBITDA(2) |
Volumes(1) |
Reportable |
Adjusted EBITDA(2) |
Volumes(1) |
Reportable |
Adjusted |
|
Pipelines |
2,571 |
(70) |
548 |
2,730 |
(992) |
577 |
2,586 |
917 |
2,102 |
2,623 |
128 |
2,208 |
|
Facilities |
866 |
160 |
285 |
884 |
143 |
255 |
870 |
715 |
1,097 |
877 |
642 |
1,012 |
|
Marketing & New Ventures(3) |
— |
224 |
183 |
— |
(684) |
75 |
— |
391 |
420 |
— |
(646) |
193 |
|
Corporate |
— |
(181) |
(46) |
— |
(114) |
(41) |
— |
(358) |
(186) |
— |
(540) |
(132) |
|
Total |
3,437 |
133 |
970 |
3,614 |
(1,647) |
866 |
3,456 |
1,665 |
3,433 |
3,500 |
(416) |
3,281 |
|
(1) |
Volumes for Pipelines and Facilities divisions are revenue volumes, which are physical volumes plus volumes recognized from take-or-pay commitments. Volumes are stated in mboe/d, with natural gas volumes converted to mboe/d from MMcf/d at a 6:1 ratio. |
|
(2) |
Refer to "Non-GAAP and Other Financial Measures". |
|
(3) |
Marketed natural gas liquids ("NGL") volumes are excluded from Volumes to avoid double counting. Refer to "Marketing & New Ventures Division" in Pembina's management's discussion and analysis dated February 24, 2022 for the year ended December 31, 2021 ("MD&A") for further information. |
Financial & Operational Highlights
Adjusted EBITDA
Change in Full Year Adjusted EBITDA ($ millions)(1)
|
(1) Refer to "Non-GAAP and Other Financial Measures". |
Pembina reported record quarterly adjusted EBITDA of $970 million and record full year adjusted EBITDA of $3,433 million, representing a twelve percent and five percent increase, respectively, over the same periods in the prior year. Full year adjusted EBITDA exceeded the high end of the Company's guidance range.
Fourth quarter adjusted EBITDA was positively impacted by higher margins on NGL and crude oil sales combined with a higher contribution from Aux Sable; higher contributions from Prince Rupert Terminal and Duvernay III coming into service in March 2021 and November 2020, respectively; and higher share of profit from Veresen Midstream, due to the Hythe Developments project entering service in March 2021 and higher volumes at the Dawson Assets.
For further details on the Company's significant assets, including definitions for capitalized terms used herein that are not otherwise defined, refer to Pembina's Annual Information Form for the year ended December 31, 2021 available at www.sedar.com (filed with the U.S. Securities and Exchange Commission at www.sec.gov under Form 40-F) and on Pembina's website at www.pembina.com.
In addition, relative to the prior period, the fourth quarter of 2021 was negatively impacted by higher realized losses on commodity-related derivative financial instruments; expiration of contracts on the Nipisi and Mitsue pipeline systems; and a lower contribution from Ruby Pipeline.
Full year adjusted EBITDA was also impacted by the same factors affecting the fourth quarter, as described above. In addition, full year adjusted EBITDA was positively impacted by higher volumes on the Peace Pipeline system, the placement into service of Empress Infrastructure in October 2020, the impact of the lower U.S. dollar exchange rate, and higher marketed NGL volumes. General & administrative expense for the full year was higher largely due to higher incentive costs, primarily driven by the change in Pembina's share price, and an increase in optimization project costs, partially offset by a reduction in salaries due to a lower headcount.
|
For further details on the Company's significant assets, including definitions for capitalized terms used herein that are not otherwise defined, refer to Pembina's Annual Information Form for the year ended December 31, 2021 available at www.sedar.com (filed with the U.S. Securities and Exchange Commission at www.sec.gov under Form 40-F) and on Pembina's website at www.pembina.com. |
Earnings
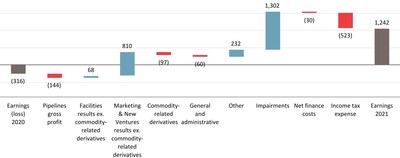
Change in Full Year Earnings ($ millions)(1)(2)
|
(1) |
Facilities results ex. commodity-related derivatives and Marketing & New Ventures results ex. commodity-related derivatives include gross profit less realized and unrealized losses on commodity-related derivative financial instruments. |
|
(2) |
Other includes other expenses, impairments and corporate. |
Pembina recorded earnings in the fourth quarter of $80 million and earnings for the full year of $1,242 million compared to a loss of $1,216 million and a loss of $316 million, respectively, in the same periods in the prior year.
In addition to the factors impacting adjusted EBITDA, as noted above, earnings in both periods were positively impacted by lower non-cash after-tax impairments. Pembina recognized $335 million, net of tax, in impairments in 2021 largely related to the Nipisi and Mitsue pipeline systems as well as Edmonton South Rail Terminal, compared to $1.6 billion, net of tax, in impairments in 2020.
Both periods also were positively impacted by unrealized gains on commodity-related derivatives compared to unrealized losses in the prior year. Both periods were negatively impacted by higher income tax expense due to the deferred tax recovery on impairments in the prior year; higher other expense, which increased due to higher transformation and restructuring costs and project write-downs; and a lower share of profit from Ruby Pipeline.
Fourth quarter earnings were also negatively impacted by unrealized losses on commodity-related derivatives for certain gas processing fees tied to AECO prices, and higher net finance costs due to lower foreign exchange gains.
Full year earnings also were positively impacted by unrealized gains on commodity-related derivatives for certain gas processing fees tied to AECO prices and higher other income due to the receipt of the termination fee associated with Pembina's proposed acquisition of Inter Pipeline Ltd. ("Arrangement Termination Payment"), net of the related tax and associated expenses. These positive factors were offset by lower other income associated with the Canadian Emergency Wage Subsidy received in 2020.
Cash Flow From Operating Activities
Cash flow from operating activities of $697 million for the fourth quarter and $2,650 million for the full year represent a decrease of nine percent and an increase of 18 percent, respectively, over the same periods in the prior year.
The decrease in the fourth quarter was primarily driven by a change in non-cash working capital and an increase in taxes paid, primarily related to the Arrangement Termination Payment, partially offset by an increase in operating results after adjusting for non-cash items, an increase in revenue collected and deferred, and an increase in distributions from equity accounted investees.
The full year increase was due primarily to an increase in operating results after adjusting for non-cash items, and receipt of the Arrangement Termination Payment, partially offset by an increase in taxes paid and an increase in net interest paid.
On a per share (basic) basis, cash flow from operating activities for the fourth quarter and full year decreased by nine percent and increased by 18 percent, respectively, compared to the same periods in the prior year, due to the same factors.
Adjusted Cash Flow From Operating Activities
Quarterly and record full year adjusted cash flow from operating activities of $734 million and $2,640 million, respectively, represent 22 percent and 15 percent increases, respectively, over the same periods in the prior year. The increases were due to the factors impacting cash flow from operating activities, discussed above, net of the change in non-cash working capital, taxes paid, and lower current tax expense. On a per share (basic) basis, adjusted cash flow from operating activities for the fourth quarter and full year increased by 21 percent and 15 percent, respectively, compared to the same periods in the prior year, due to the same factors.
Volumes
Total volumes of 3,437 mboe/d for the fourth quarter and 3,456 mboe/d for the full year represent decreases of approximately five percent and one percent, respectively, over the same periods in the prior year. In both periods, volume decreases were largely attributable to the Pipelines Division, most notably on certain oil sands pipelines systems and Ruby Pipeline. Divisional volumes are discussed in further detail below.
Divisional Highlights
- Pipelines had a fourth quarter reportable segment loss before tax of $70 million compared to a loss of $992 million in the same period in the prior year. The increase was largely due to lower impairments and a higher contribution from NEBC Montney Infrastructure, partially offset by a lower contribution from Ruby Pipeline and lower volumes on Cochin Pipeline. For the full year, Pipelines had reportable segment earnings before tax of $917 million compared to $128 million in the same period in the prior year. The full year results were also driven by lower impairments and partially offset by a lower contribution from Ruby Pipeline; lower volumes on Vantage Pipeline, as end users sourced their supply from Redwater Complex; lower revenue on the Nipisi and Mitsue pipelines, due to contract expirations; the impact of the lower U.S. dollar exchange rate; increased operating expenses due to higher non-recoverable power costs; and higher general & administrative expense as a result of higher long-term incentive costs. These factors were partially offset by higher volumes on Peace Pipeline.
Pipelines reported adjusted EBITDA for the fourth quarter of $548 million and $2,102 million for the full year, which both represent five percent decreases compared to the same periods in the prior year. The decreases were due to the same items impacting reportable segment earnings (loss) before tax, discussed above, net of the decrease in impairments.
Pipelines volumes of 2,571 mboe/d in the fourth quarter and 2,586 mboe/d for the full year, represent six percent and one percent decreases, respectively, compared to the same periods in the prior year. Volumes in both periods were impacted by lower contracted volumes on the Nipisi and Mitsue pipelines, and Ruby Pipeline, as well as lower volumes on AEGS due to third-party outages and planned turnarounds. In addition, fourth quarter volumes were impacted by lower deferred revenue volumes on the Peace Pipeline system, partially offset by higher volumes on Drayton Valley Pipeline. Full year volumes were also impacted by higher volumes on Peace Pipeline.
- Facilities had reportable segment earnings before tax for the fourth quarter and full year 2021 of $160 million and $715 million, respectively, representing increases of 12 percent and 11 percent, respectively, over the same periods in the prior year. Both periods were positively impacted by the contribution from new assets placed into service, including Duvernay III and Prince Rupert Terminal; a higher contribution from Veresen Midstream due to the Hythe Developments project entering service and higher volumes at the Dawson Assets, and a realized gain on commodity-related derivatives for certain gas processing fees tied to AECO prices. In addition, the fourth quarter was positively impacted by higher contracted volumes at Younger. The full year was also impacted by higher revenue at Redwater Complex, partially offset by higher operating expenses and higher long-term incentive costs.
Facilities reported adjusted EBITDA of $285 million for the fourth quarter and $1,097 million for the full year, which represent a 12 percent and an eight percent increase, respectively, over the same periods in the prior year. The increases were due to the same items impacting reportable segment earnings (loss) before tax, discussed above.
Facilities volumes of 866 mboe/d in the fourth quarter and 870 mboe/d for the full year, represent a two percent and one percent decrease, respectively, compared to the same periods in the prior year. The quarterly and full year decreases were primarily due to lower supply volumes on East NGL System, which are now being processed by Empress Infrastructure, higher volumes associated with Duvernay III being placed into service, and higher contracted volumes at Younger. Additionally, the fourth quarter was impacted by lower volumes at Redwater Complex following third party outages, and higher volumes at Veresen Midstream's Dawson Assets.
- Marketing & New Ventures had reportable segment earnings before tax for the fourth quarter of 2021 of $224 million compared to losses of $684 million for the same periods in the prior year. The period-over-period changes were due to significant impairments in the fourth quarter of 2020. In addition, higher margins on NGL and crude oil sales as a result of higher NGL and crude oil prices, combined with a higher contribution from Aux Sable, were partially offset by higher realized losses on commodity-related derivatives. For the full year, Marketing & New Ventures had reportable segment earnings before tax of $391 million compared to losses of $646 million in 2020. In addition to the quarterly impacts noted above, the full year increase was also a result of higher marketed NGL volumes.
Marketing & New Ventures reported fourth quarter adjusted EBITDA of $183 million and $420 million for the full year, which represent a 144 percent and 118 percent increase, respectively, compared to the same periods in the prior year. The increases were due to the same items impacting reportable segment earnings (loss) before tax, discussed above, net of the impairment recognized during the fourth quarter of 2020.
Marketed NGL volumes of 193 mboe/d in the fourth quarter and 190 mboe/d for the full year, represent a seven percent decrease and four percent increase, respectively, compared to the same periods in the prior year. The fourth quarter decrease was largely due to lower ethane sales caused by third party outages, partially offset by increased propane and butane sales volumes. For the full year, higher marketed NGL volumes from monetizing previously built up storage positions during the first quarter of 2021 and higher NGL supply volumes in the second and third quarters of 2021 were largely offset by lower ethane sales during the fourth quarter of 2021.
Executive Overview
One year ago, we reflected on the significant impact the global health pandemic had on our business, noting that in 2020, Pembina effectively hit the 'pause' button but that in 2021 there was renewed optimism building …
Full story available on Benzinga.com
[ad_2]
Source link
